If you run a restaurant in the UK, there are two numbers that determine whether you stay in business or slowly bleed money: your food cost percentage and your gross profit percentage (GP%). Get them right and you have a sustainable, profitable operation. Get them wrong — or worse, ignore them — and you join the growing list of restaurants that close within their first three years.
This guide walks you through every formula you need, with real UK examples in pounds sterling, VAT considerations, industry benchmarks by restaurant type, and practical strategies to bring your numbers in line. Whether you are an experienced operator checking your margins or a new owner trying to price your first menu, this is the reference you will keep coming back to.
What Is Food Cost Percentage?
Food cost percentage tells you how much of your revenue goes back into buying ingredients. It is the single most important metric for controlling profitability in any food business.
The formula is straightforward:
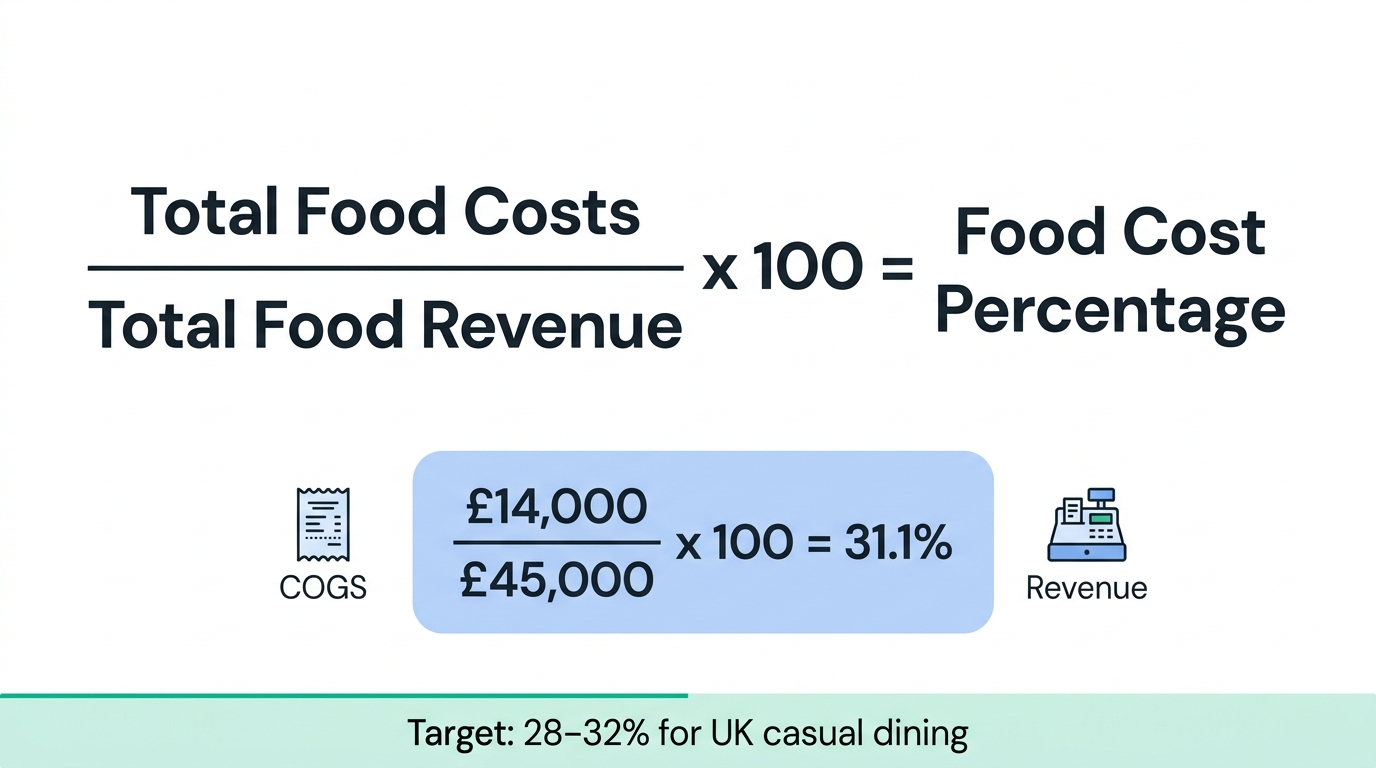
Food Cost % = (Total Food Costs ÷ Total Food Revenue) × 100
This is the industry-standard calculation used across UK hospitality, confirmed by sources including the Jelly Blog's UK Restaurant Guide (December 2025), Lightspeed UK, and Fourth.
Here is a worked example. Suppose your restaurant purchases £14,000 of food ingredients in a month and generates £45,000 in food sales during the same period:
£14,000 ÷ £45,000 × 100 = 31.1% food cost
A 31.1% food cost means that for every £1 of food revenue, roughly 31p goes to ingredients. The remaining 69p covers labour, rent, utilities, and — if you are managing well — profit.
The COGS Method: A More Accurate Approach
The basic formula above uses total purchases, but a more precise calculation uses Cost of Goods Sold (COGS), which accounts for inventory changes:
COGS = Opening Inventory + Purchases – Closing Inventory
Then: Food Cost % = (COGS ÷ Total Food Revenue) × 100
Here is why this matters. Say you start the month with £5,000 of stock, buy £14,000 of ingredients, and end the month with £6,000 of stock:
COGS = £5,000 + £14,000 – £6,000 = £13,000
Food Cost % = £13,000 ÷ £45,000 × 100 = 28.9%
That 2.2 percentage-point difference between the basic method (31.1%) and the COGS method (28.9%) represents real money — roughly £990 per month on £45,000 revenue, or nearly £12,000 per year. Using the COGS method gives you a true picture rather than an inflated one based on what you bought rather than what you used.
What Is Gross Profit Percentage (GP%)?
GP% is the mirror image of food cost percentage. Where food cost tells you what you spend, GP% tells you what you keep before overheads.
GP% = ((Revenue – COGS) ÷ Revenue) × 100
Or more simply: GP% = 100% – Food Cost %
Using our example: if your food cost is 28.9%, your GP% is 71.1%.
The Critical VAT Adjustment
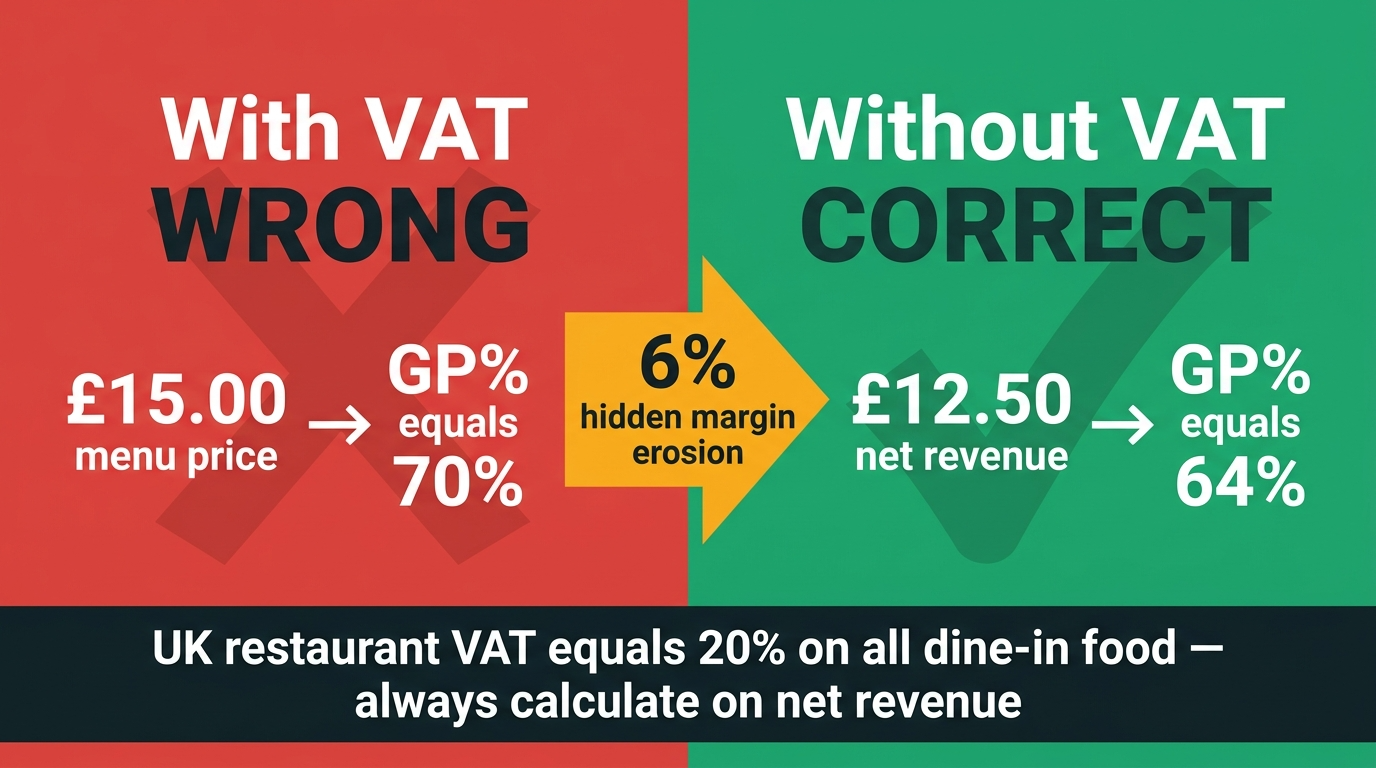
This is where many UK restaurant owners make a costly mistake. In the UK, all food consumed on premises is subject to 20% VAT (confirmed by GOV.UK and HMRC guidance current as of January 2026). Hot takeaway food is also charged at 20%. The VAT registration threshold for 2025/26 is £90,000 in taxable turnover.
You must calculate GP% on VAT-exclusive (net) revenue, not on what the customer pays. A dish that appears to sell for £15 on the menu actually generates only £12.50 in net revenue (£15 ÷ 1.20 = £12.50). If that dish costs £4.50 in ingredients:
GP% = (£12.50 – £4.50) ÷ £12.50 × 100 = 64%
If you mistakenly calculate on the VAT-inclusive price: (£15 – £4.50) ÷ £15 × 100 = 70% — a GP% that looks 6 points healthier than reality. Over a full menu and a full year, this error can hide tens of thousands of pounds in margin erosion.
UK Benchmarks: What Should Your Numbers Be?
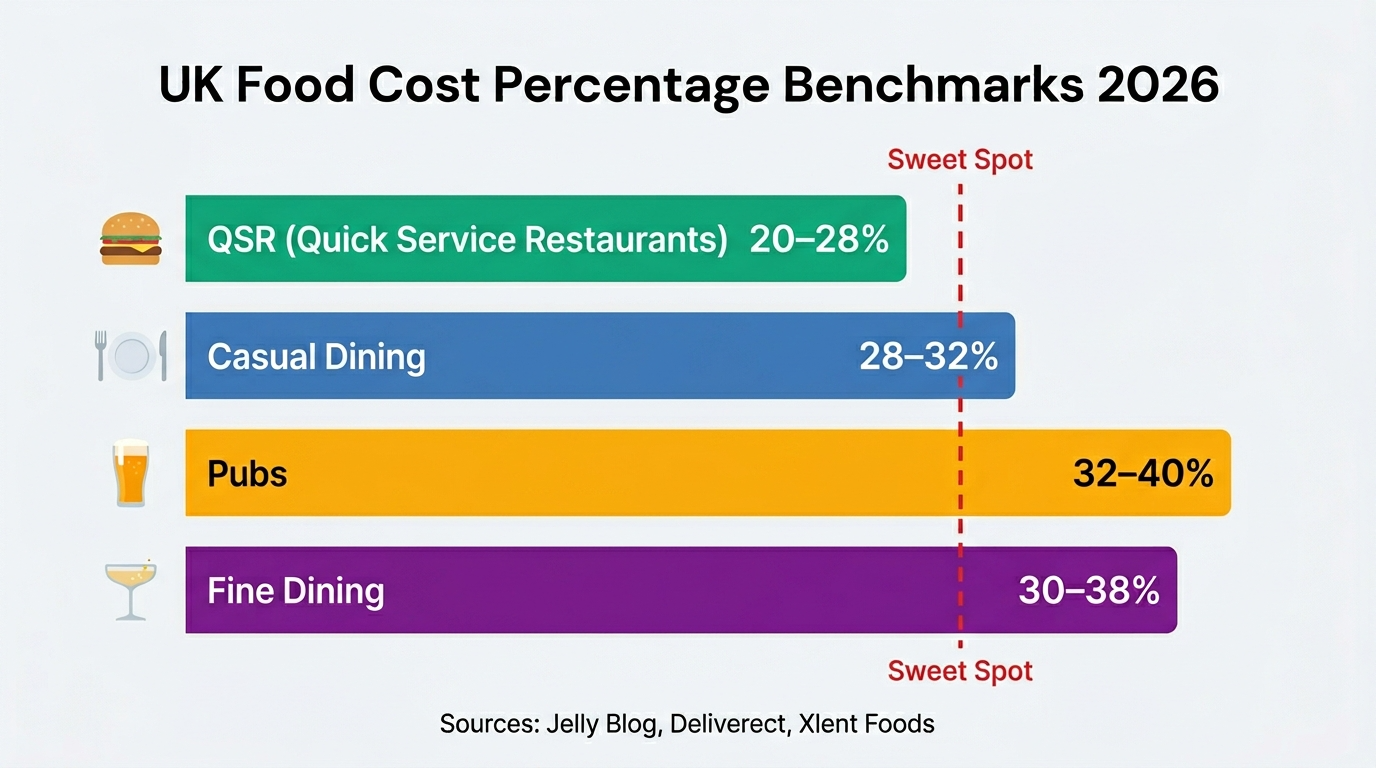
Food cost targets vary significantly by restaurant type. The following benchmarks are drawn from the Jelly Blog's UK-specific data (December 2025 and January 2026), cross-referenced with Deliverect (January 2026) and Xlent Foods (2026 guide):
Quick-service restaurants (QSR): Food cost 20–28%, GP% 72–80%. Lower ingredient costs, simpler menus, and high volume drive tighter food costs.
Casual dining: Food cost 28–32%, GP% 68–72%. This is the benchmark most full-service UK restaurants should target. A food cost below 30% signals strong control.
Pubs: Food cost 32–40%, GP% 60–68%. Higher food costs are typically offset by high-margin drinks revenue (beverage GP% can reach 80–85%).
Fine dining: Food cost 30–38%, GP% 62–70%. Premium ingredients push food costs higher, but higher selling prices and perceived value compensate.
For net profit margins after all overheads, the picture is much tighter. According to Jelly Blog (January 2026) and data corroborated by a LinkedIn analysis from MrKitchenPorter (March 2026), full-service UK restaurants average 3–6% net profit, QSR operations achieve 6–10%, and delivery or ghost kitchens can reach 10–30%.
The 30/30/30/10 rule provides a useful budgeting framework: aim for roughly 30% food costs, 30% labour costs, 30% overheads (rent, utilities, insurance, marketing), and 10% net profit.
How to Calculate the Cost of a Dish (Recipe Costing)
Before you can set menu prices or track GP%, you need to know exactly what each dish costs to produce. This is called recipe costing or plate costing, and it is the foundation of profitable menu management.
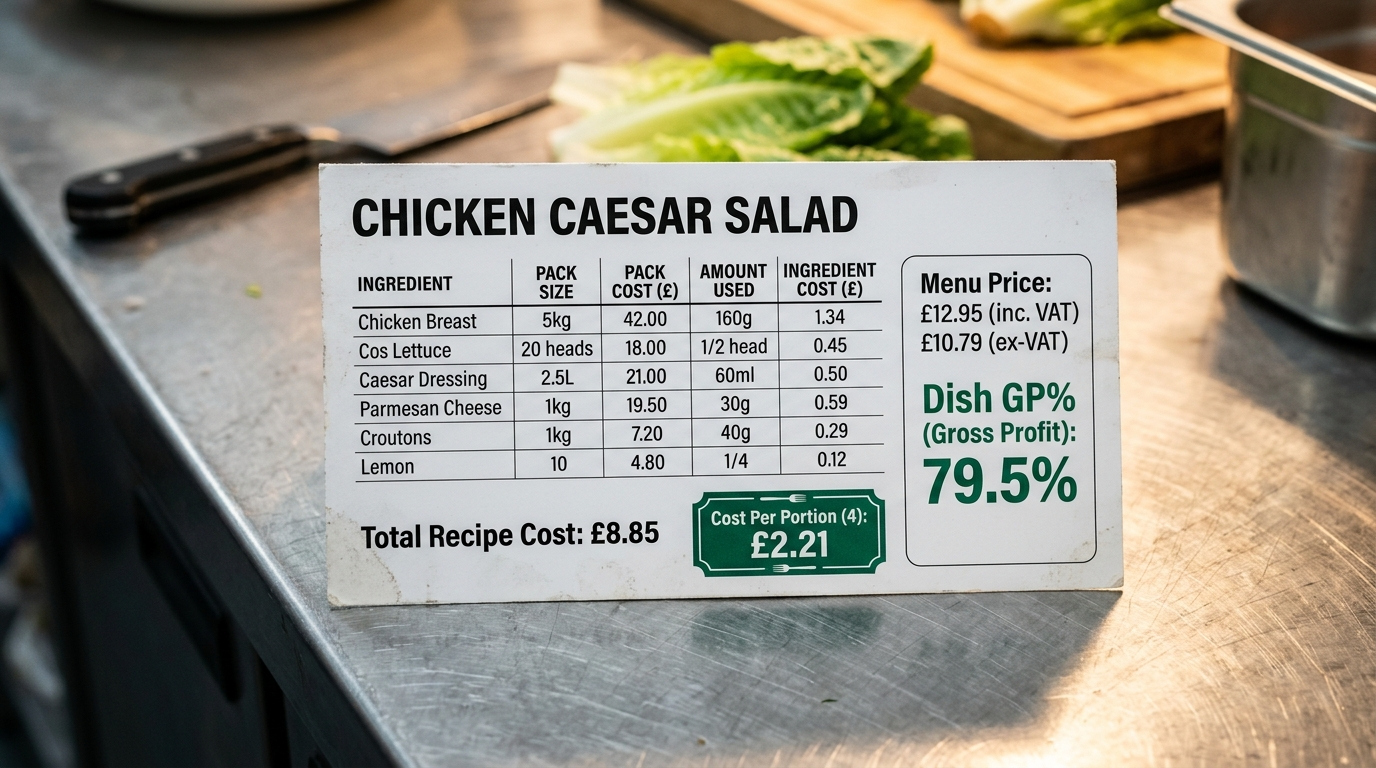
The process involves five steps. First, list every ingredient in the recipe, including garnishes, sauces, and cooking oils — everything that goes on or into the dish. Second, record the purchase price and pack size for each ingredient (e.g., chicken breast, 2kg pack, £12.50). Third, calculate the unit cost by dividing the purchase price by the usable quantity — accounting for trim, wastage, and yield (a 2kg pack of chicken breast with 10% trim yields 1.8kg usable, so the effective cost is £12.50 ÷ 1.8 = £6.94 per kg). Fourth, multiply the unit cost by the amount used in the recipe to get the ingredient cost. Fifth, sum all ingredient costs to get the total recipe cost, then divide by the number of portions to get the cost per portion.
Here is a worked example for a chicken Caesar salad serving four:
| Ingredient | Pack Size | Pack Cost | Amount Used | Ingredient Cost |
|---|---|---|---|---|
| Chicken breast | 2 kg (1.8 kg yield) | £12.50 | 600 g | £4.17 |
| Cos lettuce | 2 heads | £1.80 | 2 heads | £1.80 |
| Caesar dressing | 1 litre | £4.50 | 200 ml | £0.90 |
| Parmesan | 500 g | £8.00 | 80 g | £1.28 |
| Croutons | 500 g bag | £2.50 | 100 g | £0.50 |
| Lemon | 5 pack | £1.00 | 1 lemon | £0.20 |
| Total recipe cost | £8.85 | |||
| Cost per portion (÷ 4) | £2.21 |
If you sell this dish at £12.95 (inc. VAT), the net selling price is £10.79. Your dish GP% is: (£10.79 – £2.21) ÷ £10.79 × 100 = 79.5%, and your dish food cost is 20.5%. That is an excellent margin — well within the casual dining benchmark.
From Dish Cost to Menu Price: Pricing Strategies
Knowing your dish cost gives you a starting point, but setting the right menu price involves strategy, not just maths.
Cost-plus pricing is the most common method. Decide your target food cost percentage (say 30%), then divide the dish cost by that target: £2.21 ÷ 0.30 = £7.37 (ex-VAT), which becomes £8.84 inc. VAT. This is a floor price — the minimum you should charge to hit your target.
Competitive pricing means researching what similar restaurants in your area charge for comparable dishes. If the average chicken Caesar in your neighbourhood sells for £12–14, pricing at £8.84 may leave money on the table. Conversely, pricing at £16 when competitors charge £12 requires a clear value justification.
Psychological pricing uses subtle techniques to guide customer choices. Anchor pricing places a premium item (such as a £32 steak) at the top of a menu section, making a £18 main course feel reasonable by comparison. Charm pricing uses prices ending in .95 or .50 rather than round numbers — £12.95 feels noticeably cheaper than £13.00 to most diners. Removing the pound sign (writing 12.95 instead of £12.95) can also reduce price sensitivity, though this is more common in fine dining.
The most effective approach combines all three: set a floor using cost-plus, validate against the competitive landscape, and fine-tune using psychology.
The Hidden Costs That Erode GP%
Even with perfect recipe costing and smart pricing, several factors can silently destroy your margins.
Waste and spoilage is the biggest culprit. According to WRAP, UK restaurants produce nearly 200,000 tonnes of food waste annually, valued at approximately £682 million. The broader hospitality and food service sector wastes 1.1 million tonnes per year, costing the sector £3.2 billion — an average of £10,000 per outlet per year. WRAP estimates that 10% of food purchased by restaurants never reaches the customer, and that food waste accounts for approximately 6% of total restaurant sales. The message is clear: every point of waste you eliminate flows directly to your bottom line.
Inconsistent portioning is the second major leak. If your recipe card says 150g of salmon per portion but your chefs are plating 180g, you have just added 20% to that ingredient cost without generating a penny more in revenue. Across a busy week, uncontrolled portions can add hundreds or even thousands of pounds to your food costs.
Supplier price creep is particularly acute in 2026. The Food & Drink Federation forecast UK food inflation averaging around 3.1–4.4% through 2026, and Reuters reported food inflation of approximately 3.3% in early 2026. If you are not reviewing supplier invoices and updating recipe costs at least monthly, your GP% calculations are based on fiction.
Theft and unrecorded usage — staff meals, complimentary drinks, and ingredients used for specials or tastings that are never logged — can account for 2–5% of food costs in poorly controlled operations.
Seven Practical Strategies to Improve Food Cost & GP%
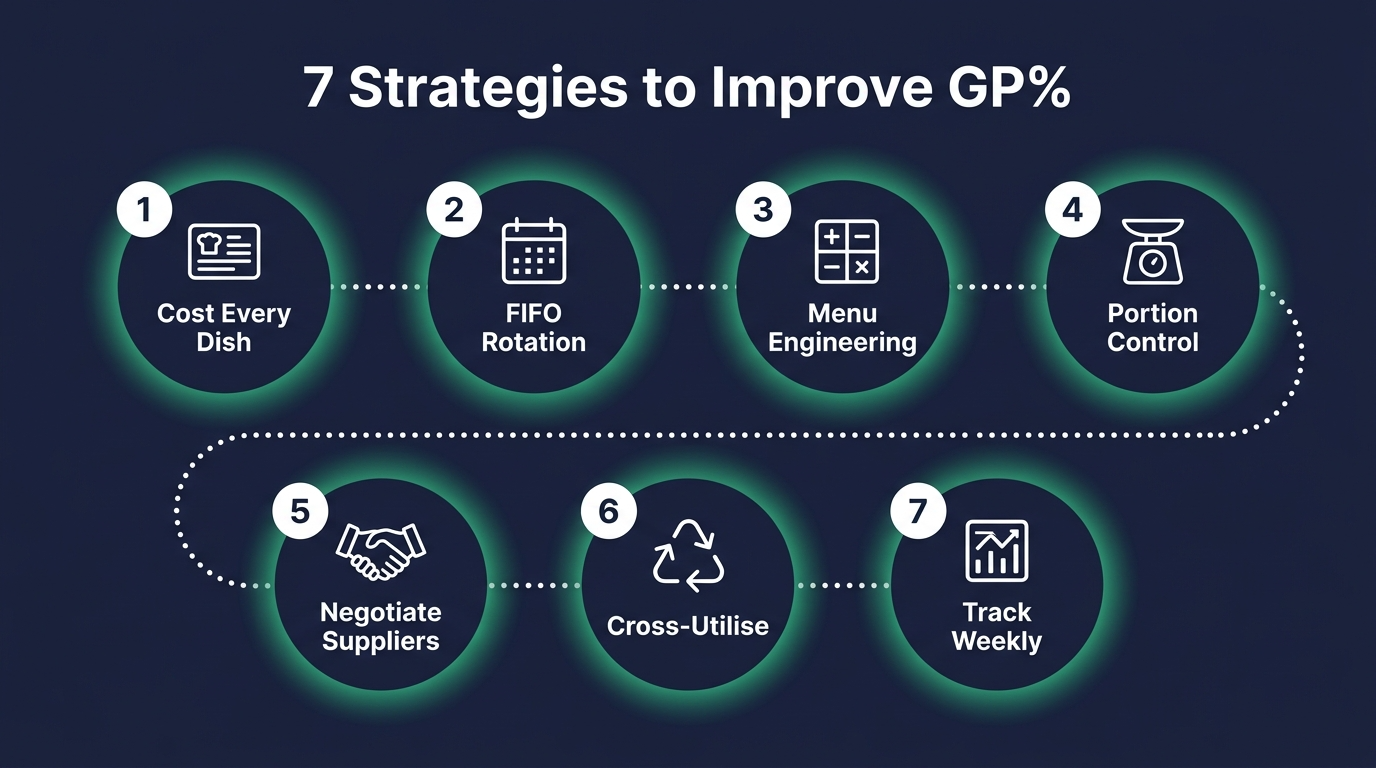
Strategy 1: Recipe-cost every dish and update monthly. This is non-negotiable. A recipe card with accurate costs, portion sizes, and preparation photos is the foundation. When supplier prices change — and in 2026, they change frequently — update the costs and recalculate your GP%.
Strategy 2: Implement FIFO stock rotation. First In, First Out is the simplest way to reduce spoilage. Label everything with delivery dates and ensure older stock is used first. WRAP research indicates that food preparation waste accounts for 45% of restaurant food waste — much of which is preventable spoilage.
Strategy 3: Engineer your menu using the Boston Matrix. Classify every dish as a Star (high popularity, high GP), Plowhorse (high popularity, low GP), Puzzle (low popularity, high GP), or Dog (low popularity, low GP). Promote Stars, re-engineer Plowhorses (reduce ingredient cost or raise price), market Puzzles (they are profitable but unknown), and consider removing Dogs.
Strategy 4: Standardise portions with scales and tools. Invest in portion scales, ladles with known volumes, and ring moulds. The cost is negligible compared to the savings. A kitchen where every cook plates by eye is a kitchen losing money.
Strategy 5: Negotiate supplier terms and cross-reference prices. Do not accept annual price increases without challenge. Get quotes from at least two suppliers for your top 20 ingredients by spend. Even a 3% reduction on your highest-cost items can shift your overall food cost by a full percentage point.
Strategy 6: Cross-utilise ingredients across menu items. A slow-braised beef used in a main course can become a pie filling, a ragu for pasta, or a topping for loaded fries. Reducing the number of unique ingredients lowers waste, simplifies ordering, and improves consistency.
Strategy 7: Track food cost weekly, not monthly. A monthly food cost review tells you what went wrong four weeks ago. A weekly review — even a quick flash report comparing purchases to sales — lets you catch problems while you can still fix them.
Calculating Your Break-Even Point
Understanding your break-even point tells you the minimum revenue you need to cover all costs before making any profit. The formula is:
Break-Even Revenue = Total Fixed Costs ÷ GP%
Say your monthly fixed costs (rent, wages, utilities, insurance, loan repayments, etc.) total £30,000 and your GP% is 68%:
£30,000 ÷ 0.68 = £44,118
You need at least £44,118 in monthly food revenue (ex-VAT) to break even. Every pound above that is potential profit. If your average spend per cover is £25 (ex-VAT) and you are open 26 days per month, you need:
£44,118 ÷ 26 ÷ £25 = 68 covers per day to break even
This is an enormously powerful planning tool. It tells you whether your pricing, seating capacity, and turnover rate can actually sustain the business — before you open the doors.
Where MenuMargin Fits In
MenuMargin is UK restaurant menu audit and profitability software. Your first result is free, a full menu audit is a one-off £29, and Pro is £39 per month. The free audit reviews the pricing, descriptions and structure visible on your current menu. To measure profitability you add your own recipes and ingredient costs: MenuMargin then calculates per-portion food cost and GP% and shows it with traffic-light colour coding (green for on-target, amber for marginal, red for loss-making). The AI Magic Button can draft price and description suggestions for you to review.
MenuMargin does not currently integrate with POS systems or inventory management platforms, which means your COGS calculation will still require manual stock counts. For operators who need POS-linked, live food-cost tracking, platforms such as Jelly (£129/month) or Brikly's CostingBrik module (from £39/month) offer that capability. MenuMargin's strength is in combining a menu audit, recipe costing, menu templates and allergen records in a single interface — ideal for independent restaurants and cafés that want to start tracking GP% without enterprise-level complexity or cost.
Sources & Citations:
- Jelly Blog. (2025, December 20). Calculate Food Cost Percentage: UK Restaurant Guide 2026. https://blog.getjelly.co.uk/calculate-food-cost-percentage/
- Jelly Blog. (2025, December 6). UK Restaurant Gross Profit Margin Benchmarks Guide 2026. https://blog.getjelly.co.uk/restaurant-gross-profit-margin-benchmarks/
- Jelly Blog. (2026, January 4). UK Restaurant Profit Margins 2026: Automation vs Manual. https://blog.getjelly.co.uk/benchmark-restaurant-profit-margins-uk/
- Deliverect. (2026, January 19). Calculate Your Food Cost Percentage And Secure Your Bottom Line. https://www.deliverect.com/en-gb/blog/expert-talks/calculate-your-food-cost-percentage-and-secure-your-bottom-line
- Fourth. (n.d.). How To Calculate and Reduce Restaurant Food Cost. https://uk.fourth.com/article/restaurant-food-cost
- Lightspeed UK. (2022, April 4). How to Calculate Food Costs for Your Restaurant Menu. https://www.lightspeedhq.com/uk/blog/how-to-calculate-restaurant-food-costs-uk/
- GOV.UK. (n.d.). VAT Rates. https://www.gov.uk/vat-rates
- Reflex Accounting. (2026, January). VAT on Food and Drink. https://reflexaccounting.co.uk/vat-on-food-and-drink/
- WRAP. (2025, July 2). UK Food Waste & Food Surplus – Key Facts. https://www.wrap.ngo/resources/report/uk-food-waste-food-surplus-key-facts
- WRAP. (n.d.). Hospitality and Food Service. https://www.wrap.ngo/taking-action/food-drink/sectors/hospitality-food-service
- BusinessWaste.co.uk. (2024, April 12; updated 2026, January 29). Restaurant Waste Statistics. https://www.businesswaste.co.uk/waste-facts/restaurant-waste-statistics/
- Food & Drink Federation. (2025, September). UK Food & Drink Inflation 2025–26 Forecast. https://www.fdf.org.uk/fdf/resources/publications/reports/uk-food--drink-inflation-2025-26-forecast/
- Reuters. (2026, January 6). UK food prices and shop price inflation pick up at end-2025. https://www.reuters.com/sustainability/sustainable-finance-reporting/uk-food-prices-shop-price-inflation-pick-up-end-2025-survey-shows-2026-01-06/
- MrKitchenPorter via LinkedIn. (2026, March 11). UK Restaurant Profitability Data Reveals Challenges Ahead. https://www.linkedin.com/posts/mrkitchenporter_restaurantdata-ukhospitality-foodindustry-activity-7437452881923911682-Ywuj
- Xlent Foods. (2026). Food Cost & Margin Guide. https://www.xlentfoods.com/guides/food-cost-margin-guide
- MenuMargin. (2026). Pricing. https://menumargin.co.uk/pricing
This information is verified as of 25 March 2026, but verify independently for critical financial decisions.